Introducing the Star CBM Data Insights dashboard
Effective administrators and educators play an important role as assessment and accountability champions. They make sure timely, appropriate assessments are given to provide the necessary data to inform decision making. They track student performance and growth compared to state or local benchmarks. And they use assessment data to check that curriculum and instruction are having the desired impact on student growth.
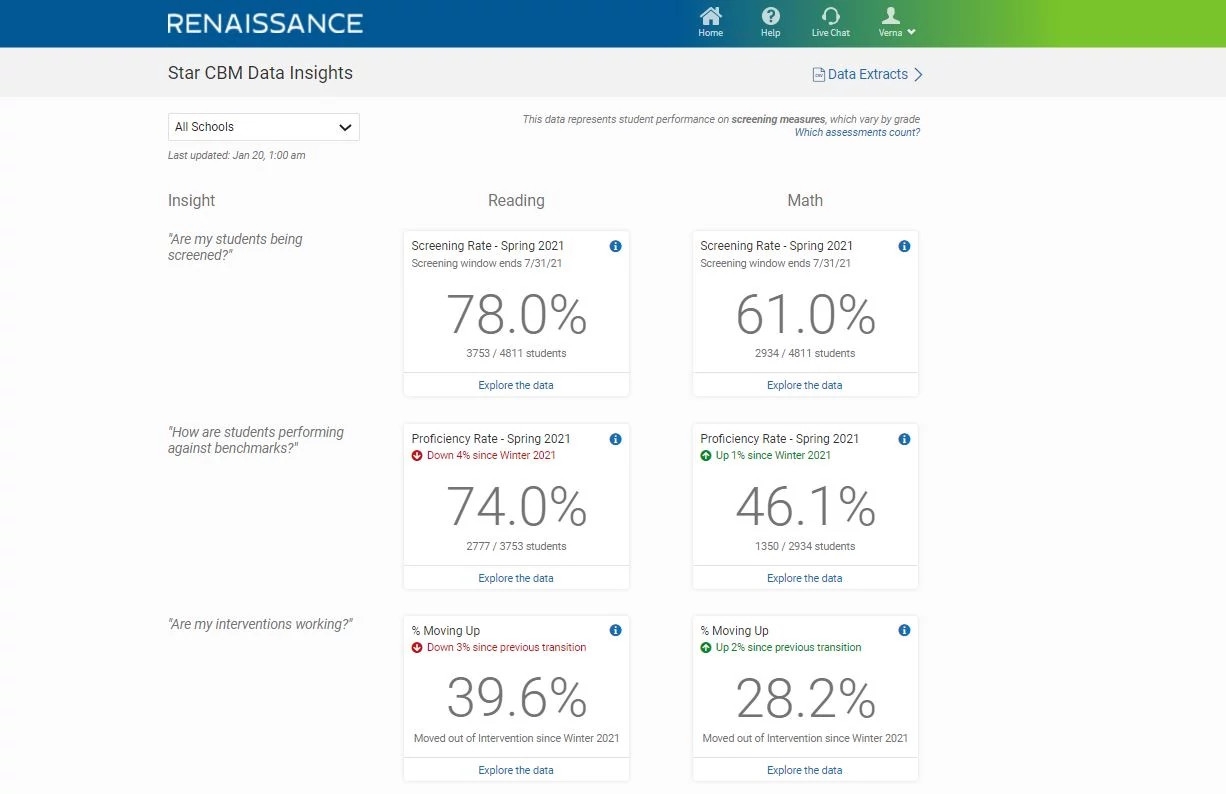
The Star CBM Data Insights dashboard provides school and district administrators, along with teachers, an expedient, convenient place to track progress in Star CBM Reading and Star CBM Math. Dashboard tiles provide data rolled up to the school, district, or class level related to three essential questions that you can expand to explore in more depth.

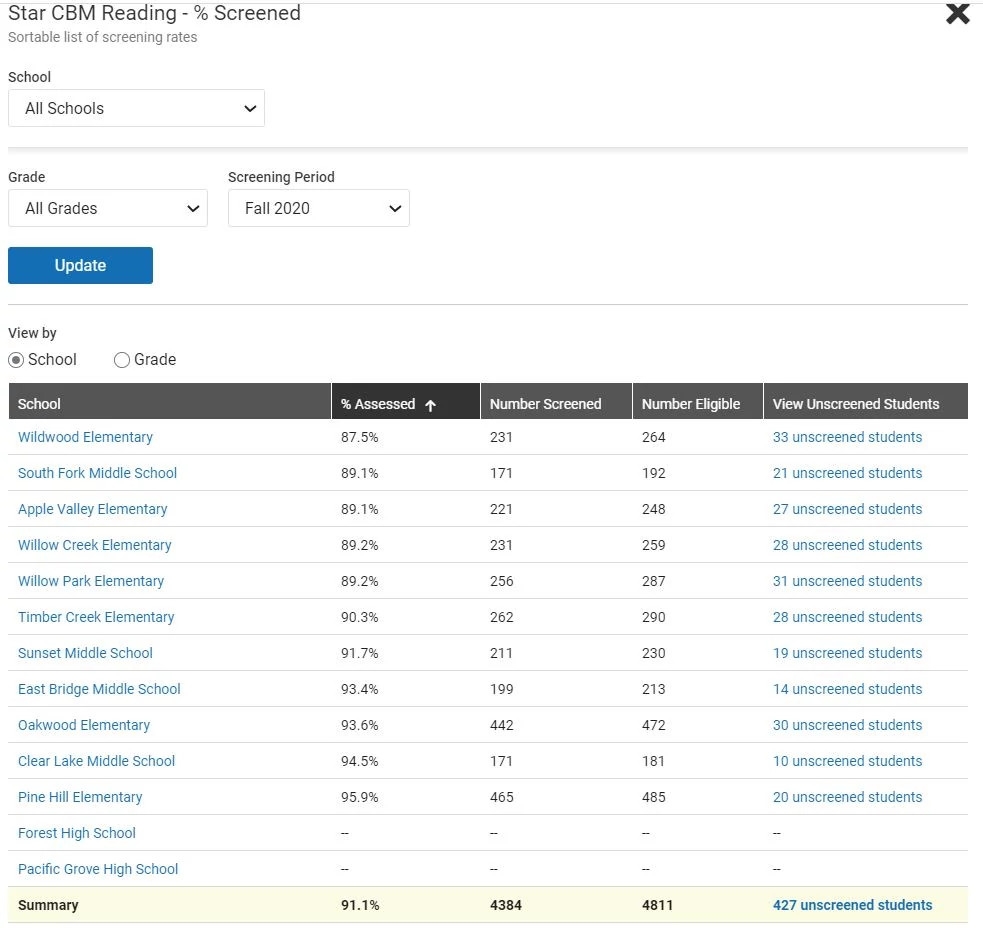
Are my students being screened?
Checking the percentage of students screened helps with scheduling and planning for assessment within appropriate testing timeframes. In schools that conduct universal screening, knowing how many students have been screened is a key metric to ensure you’re looking at data that represents a significant portion of your population. You’ll also see when the current screening window ends so you can schedule assessments accordingly.

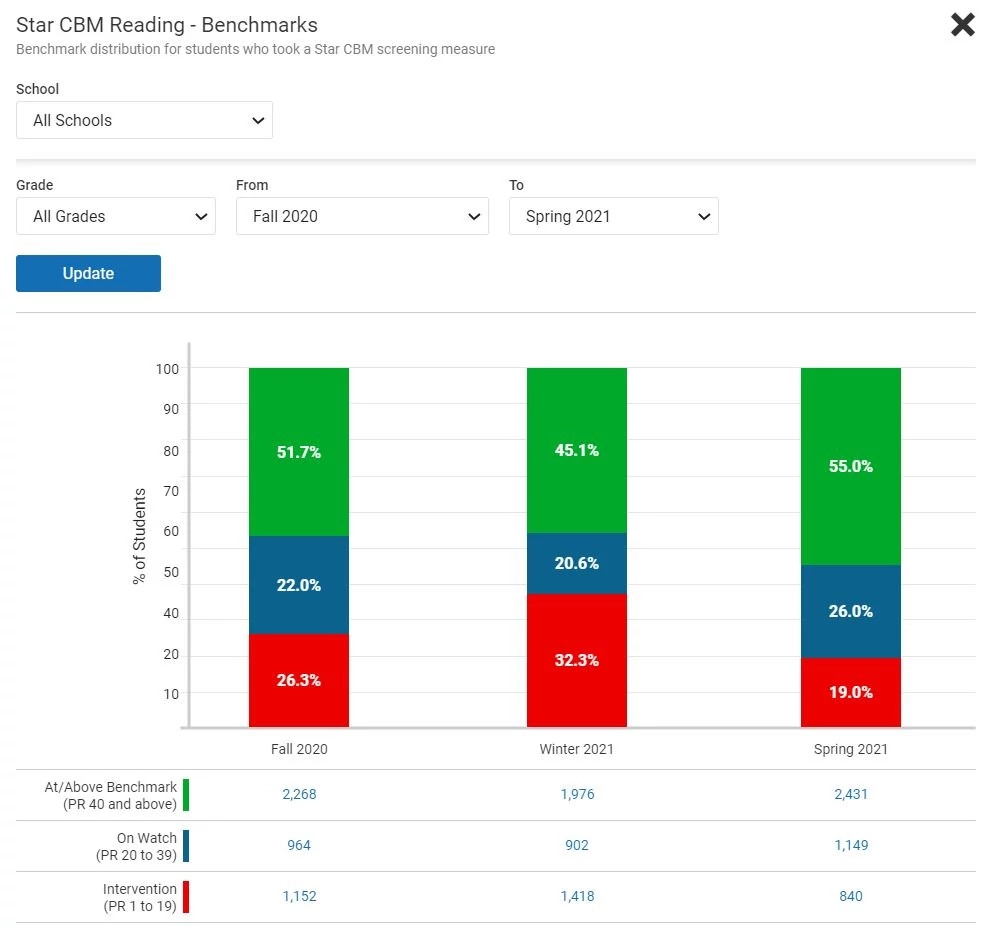
How are students performing against benchmarks?
After completing a screening measure, the main question educators want to understand is how well students performed compared to grade-level benchmarks. Exploring this question will let you see the distribution of scores across benchmark categories and compare results across multiple screening windows. You’ll be better equipped to make decisions about intervention needs and resource allocation with this information in hand.

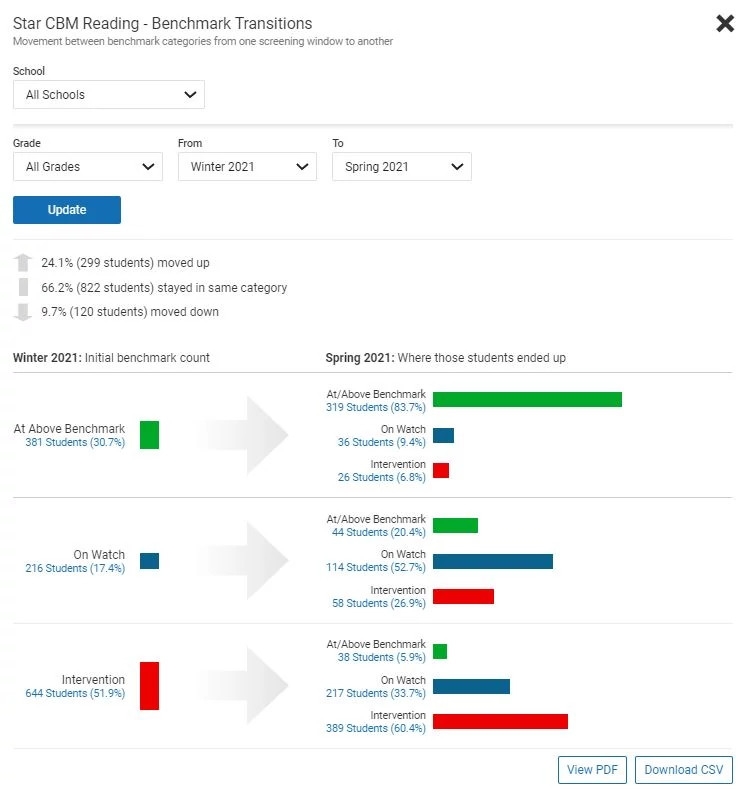
Are my interventions working?
Knowing the impact of instruction and intervention on student performance is a key indicator of success. Here you’ll see the percentage of students who are moving up to a new benchmark category and how it compares to changes from the previous seasonal transition. These metrics help you spot trends so you can identify areas of concern and success and make necessary modifications.

In addition to on-screen views of these dashboard metrics, you can also download PDF views and CSV files to easily add this data to your records.
Get to know these metrics on the Star CBM Data Insights dashboard. Even more dashboard reporting is planned for the future to provide additional insights on even more critical questions.
