Accelerated Reader data now available in Renaissance Analytics
Accelerated Reader customers can now get a better understanding of how Accelerated Reader is being used in their district using their Renaissance Analytics dashboards. As a reminder, customers can get access to Renaissance Analytics at no additional charge to monitor the implementation of all their Renaissance solutions at the district and school level.
District and school leaders can get answers to questions like:
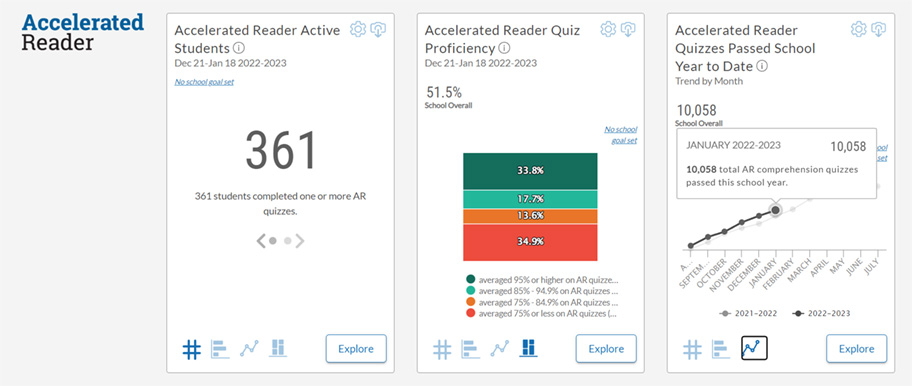
- How many students have taken one or more AR quizzes in the last month?
- What percentage of my students have a quiz average of 85% or higher over the last month?
- What is the total number of quizzes passed so far this school year?
In addition, for individual students, you can see the number of quizzes taken during the last month and the average percent correct for those quizzes.
Here is a preview of how the new metrics will appear on your dashboard:

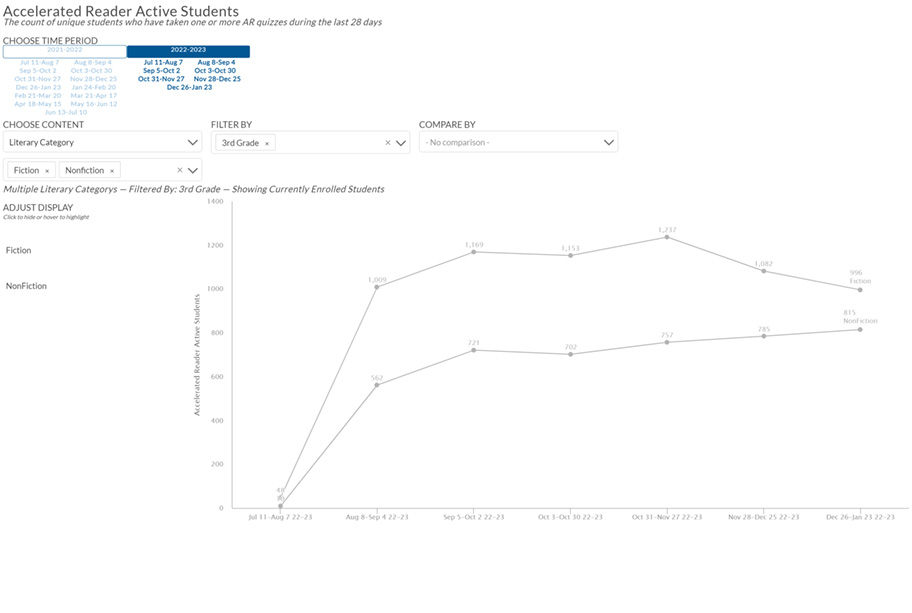
As with all Renaissance Analytics metrics, you can see analytics at a summary level, disaggregated by student demographics and school groups, trends over time, student-level data, or deeper analyses with the Explore feature.

With Explore, customers can dig deeper with filters that can be customized to display longitudinal data. For example, customers can filter between fiction vs. nonfiction quizzes, specific marking periods, and student groupings.
With this new addition, district and school leaders can get quick insights into their implementations of Star, Freckle, and AR in a single view. In continuing to strengthen the interconnectedness of our solutions, Renaissance empowers educators to make impactful decisions confidently to improve outcomes for all students and schools.
